Some programmers consider profiling code to be some unknown magic only wizards from A Great Age can do and they only can because of the years they’ve put in to the practice. I know because I used to be one of them until I learned more about two handy tools under the extremely useful go command.
These tools make it easy for anyone to have a look under the hood of their Go code and are highly encouraged to by the community, but only when performance becomes a true concern. In fact, most performance questions I see about Go are almost always met with a “Have you benchmarked it yet?” before going any further. It’s not to deter the questioner, it’s just too easy not to. With a benchmark, a more beneficial and informative discussion to continue.
Hopefully, the rest of this post will show you how quick it can be to profile some of your code. If your servers are on fire and you desparately need to find the problem and get some sleep, there’s a TL;DR at the bottom. Otherwise read along so you can learn to fish instead of fill your appetite.
Let’s Make A Benchmark
This seems to usually be the barrier to entry for a lot of programmers. Coming from other languages, making benchmarks usually requires finding a library to help make it less painful but Go’s awesome std lib saves the day again. If you didn’t already know, Go has an awesome testing package with all the functionality you need to write solid tests. What is even more outstanding is it provides all you need for simple benchmarking!
Just like there’s a testing.T, there is a testing.B with useful functions and capabilities for making benchmarks. The most important is b.N because it decides how many times to run a function in order to get accurate results. See? We already don’t have to think about a pretty complicated thing in order to have correct enough benchmarks for our needs.
The other thing a testing.B gives us is the b.ReportAllocs() method. This will tell the testing package to provide allocation information in the test binary we are about to create.
In my opinion, the simplest step to making your first benchmark is to simply copy a happy path test for the function you want to benchmark and make some slight adjustments to it. This is assuming good testing practices are in play so your setup and teardown methods give you an environment where you’re comfortable with this function running many times. It should look something like this:
package suspect_test

import "testing"

TestSuspect(b *testing.B) {
	testSetup()
	Suspect()
  	// test assertions!
	testTeardown()
}

BenchmarkSuspect(b *testing.B) {
	testSetup()
	b.ReportAllocs()
	for i := 0; i < b.N; i++ {
		Suspect()
	}
	testTeardown()
}
With a benchmark in place, we now get to use the awesome go command to interact with it.
I Wanna Go Fast!
First, we can run our benchmark with go test and get an overview of the function. This output is useful for getting before and after stats to confirm any changes made for performance actually succeeded and by how much. Someone even built a tool to understand this output and do all the comparison math for you, called benchcmp! Just run go get golang.org/x/tools/cmd/benchcmp to install it.
We make sure to tell go test to not run any actual tests in order to keep our machine reasonably quiet by giving -run= a regexp matching nothing. I could have used some text that wouldn’t match a test name like NONE or asldghlksd instead, but I like to keep those names in my back pocket… you know… just in case.
go test -run=^$ -bench=BenchmarkSuspect | tee initialbench.txt
BenchmarkSuspect-4	100	10652038 ns/op	3977365 B/op	16243 allocs/op
PASS
ok  	github.com/username/suspect/	1.092s
And an example of benchcmp in action
benchmark             old ns/op     new ns/op     delta
BenchmarkSuspect-4     10652038      1315424       -87.65%

benchmark             old allocs     new allocs     delta
BenchmarkSuspect-4     16243          2978           -81.67%

benchmark             old bytes     new bytes     delta
BenchmarkSuspect-4     3977365       319078        -91.98%
Now we have this stored in initialbench.txt and it has a lot of useful information in here we can look at. First, the -4 after the benchmark name tells us how many cores the host machine has. The next number, 100, informs us how many times the testing package decided to run the benchmark (remember b.N?).
While this print out is useful, it only lets us kick the tires. We can use go test to create some files for us so we can dig deeper into the Suspect function. The command below creates both a cpu and memory profile, along with keeping the binary built to run the tests with all the information put inside it from the testing package:
go test -run=^$ -bench=BenchmarkSuspect -cpuprofile=prof.cpu -memprofile=prof.mem
Under The Hood
With these files, we can use go tool pprof to do a deep dive into what the function is actually doing. pprof takes the binary built by go test and the profile information it is given and provides a prompt where one can continue to analyze the data collected in those two files.
suspect.test is the test binary created (named after the package) and -alloc_space tells pprof to report how many allocations any code makes
go tool pprof suspect.test prof.cpu
go tool pprof -alloc_space suspect.test prof.mem
We’re officially in Super Awesome Magic Land for me, but I’ll give you a tour of the commands I’ve learned and have found the most useful.
First, there is top. This command lists the top ten nodes (think functions) occupying either your cpu time or memory allocations.
(pprof) top
293.99MB of 350.60MB total (83.85%)
Dropped 41 nodes (cum <= 1.75MB)
Showing top 10 nodes out of 211 (cum >= 18MB)
      flat  flat%   sum%        cum   cum%
  194.39MB 55.44% 55.44%   194.39MB 55.44%  compress/flate.NewReader
   26.23MB  7.48% 62.92%    26.23MB  7.48%  regexp.(*bitState).reset
   20.10MB  5.73% 68.66%    20.10MB  5.73%  bytes.makeSlice
   15.04MB  4.29% 72.95%    15.04MB  4.29%  runtime.rawstringtmp
    9.07MB  2.59% 75.53%     9.07MB  2.59%  reflect.unsafe_NewArray
       8MB  2.28% 77.82%    11.01MB  3.14%  runtime.mapassign
       ...
For the problem code I ran this on, it says a lot of the allocations are in the compress package. But I didn’t write any compression code! Hm. I need to see which one of my functions is causing this flate.NewReader to be called. Wouldn’t it be nice if I could just take a glance at a nice call graph of my benchmark?
We can do exactly that with the web command:
Just make sure you have graphviz installed before you run it because web uses it to create an svg and then uses your system’s browser to open it.
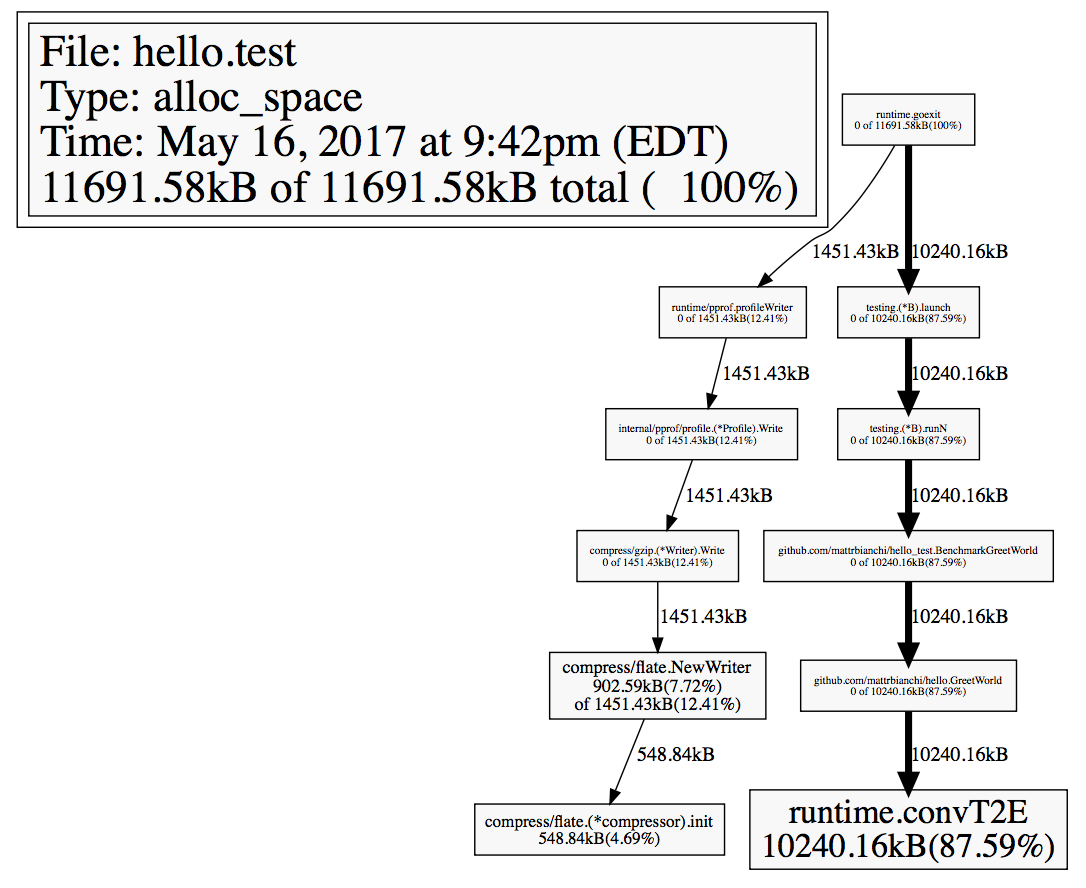
From here, the boxes with bigger fonts to represent the function name hint that those functions are your “heavy hitters” — this could be cpu or memory-wise, depending on what you told pprof to load.
For instance, the above image is of a memory profile and while how many allocations my beloved hello world program makes is none of your beeswax, it seems like I’d have to stop using fmt.Println to win any extreme hello world hackathons. This is because it takes an empty interface, which forces Go to do some things behind the scenes in order for it to know how to print what I gave it.
Otto Von Benchmark
Now I believe you have all you need to start writing some initial benchmarks to monitor the performance of your app throughout its lifecycle. This is a valuable asset, as it gives proper insight into what is actually causing problems instead of spending developer time speculating and rewriting innocent code. Not only will this save the company money, but can prevent arguments between teammates and keep the peace!
Obviously, if you operate at a very large scale and performance is of the utmost concern, there is more studying to be done for highly accurate benchmarks. That being said, I’ve been able to keep within the bounds of this article to quickly find problem areas in code and smooth them over in order to improve UX when needed.
Thank You
I took “Go: Beyond the Basics” from Brian Ketelsen, who initially showed me the go tool’s profiling capabilities and I believe he pointed us to Brad Fitzpatrick’s talk where Brad performs a live demo of a lot of this in action, which you can find here. Brad’s demo includes even more of Go’s awesome tooling like the race detector, so I highly encourage you to watch it in your free time.
TL;DR
BenchmarkSuspect(b *testing.B) {
	b.ReportAllocs()
	// Keep all prep outside the loop for accuracy.
	for i := 0; i < b.N; i++ {
		Suspect()
	}
}
go test -run=^$ -bench=BenchmarkSuspect -cpuprofile=prof.cpu -memprofile=prof.mem
go tool pprof suspect.test prof.cpu
# OR
go tool pprof -alloc_space suspect.test prof.mem
# popular pprof commands
web
list Suspect
top
top --cum